

MENTAL HEALTH
The right attitude
WORDS: Nerida Saunders PHOTOGRAPHY Supplied
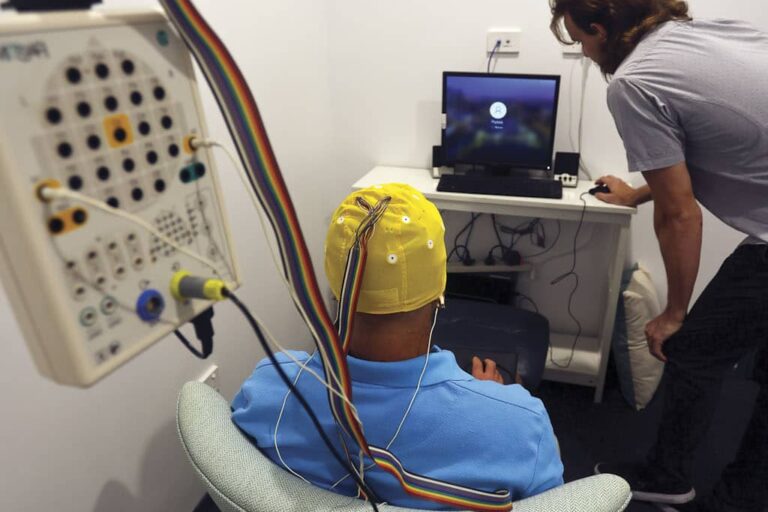
Brain Care director and consultant psychologist Nerida Saunders says Dick and Lynn’s attitude has helped them get the best out of Dick’s treatment.
DICK and Lynn were extremely dedicated and motivated with their therapy at Brain Care and the results reflect this.
During his initial assessment, Dick’s son, Malcolm, said something along the lines of ‘he’ll be the best client you ever have; he’ll do whatever you ask and whatever it takes’. And he definitely did. Dick was initially quite withdrawn and shy. He avoided social interaction and encounters and had a diminished sense of purpose, motivation and self-confidence.
As sessions progressed, Dick’s demeanour changed – something Lynn and Malcolm also noticed. Dick took a while to become aware of these changes, despite Lynn providing him with specific examples. This is something we often see at Brain Care – families and friends observing changes before the client.
By the end, Dick was starting to notice and report these changes himself, although somewhat hesitantly due to his humble nature. He could point out positives in his day-to-day routine. He was feeling more motivated, was sleeping better and was more willing to engage socially with others, even at large events. Family who had not seen him since he started the therapy could not believe the difference.
The graph below is a spectral presentation of Dick’s EEG and displays the power (X-axis) of his brainwaves for different speeds or frequencies (Y-axis, ranging from 0-40 cycles per second). The colours divide the brainwaves into different band ranges of delta (brown0-4hz), theta (red, 4-7hz), alpha (Yellow, 8-12hz), SMR (white, 12-15hz) and Beta (Green, 15-30hz).
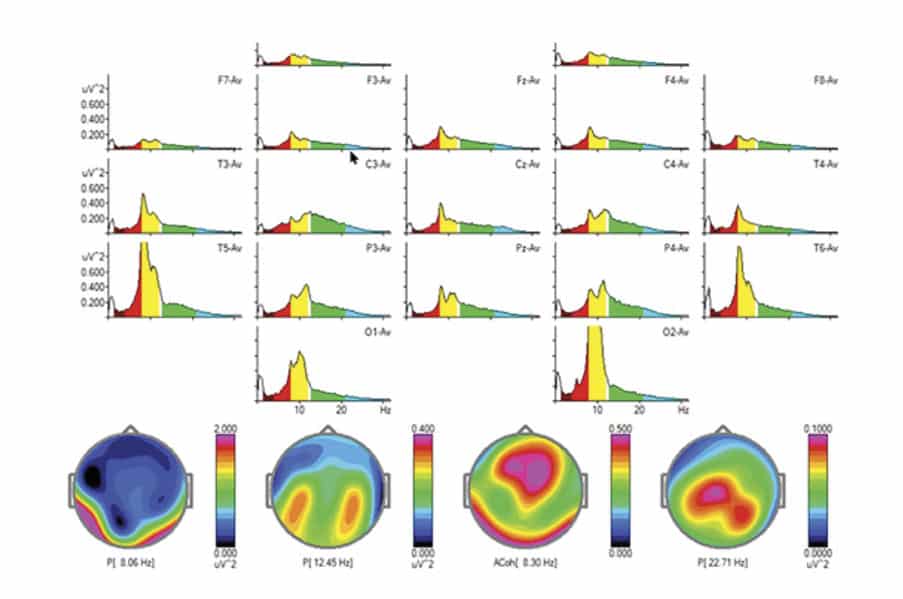
The topographical brain maps display the power distribution over the head for a specific frequency and help pinpoint the largest deviations for that frequency so we can determine protocols for training. Training is completely personalised, based on individual brain mapping.
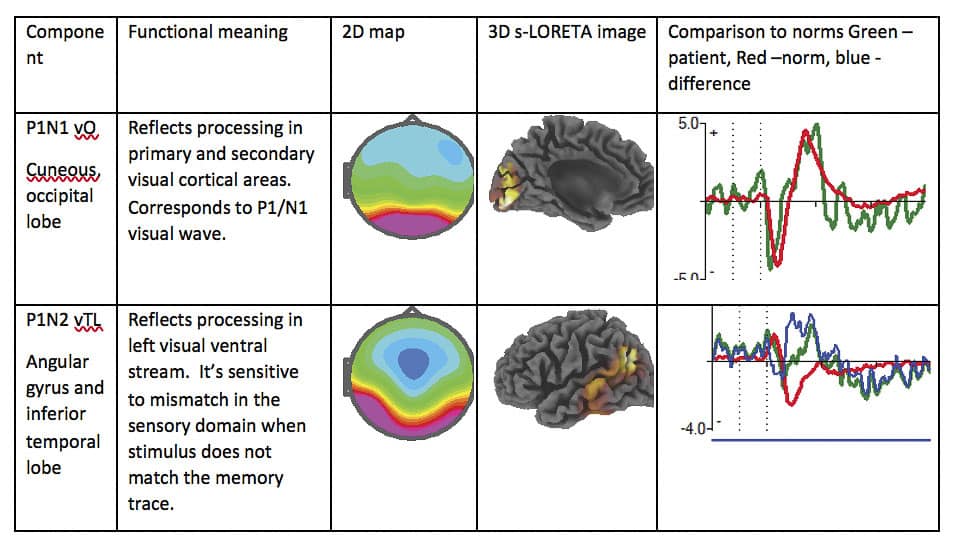
The next chart shows Dick’s brainwaves in response to a task. It tracks how much ‘brain power’ Dick is using for a particular neural or cognitive function and compares it to the normative database. The red line indicates the typical response for peers. The green line is Dick’s response and the blue line is the difference between the two.
Dick continues to progress with the support of his extraordinary wife, who will stop at nothing to assist him. They plan to come back to Brain Care later in the year to continue training and to enhance the progress Dick has already made. The neuroplasticity of the brain – the ability of the brain to change itself – is a complete wonder.